JENNIFER SUSANNE SOMMERS / SOTHEBY’S INTERNATIONAL REALTY
THE SOUTH FLORIDA MARKET EDIT
A clearer view of
South Florida real estate.
Palm Beach. Broward. Miami-Dade.
Luxury market intelligence for your next move.
Q3 2026 / JULY – SEPTEMBER
THE QUARTER IN PERSPECTIVE
Local intelligence.
A broader perspective.
A market report gives you context. A thoughtful real estate strategy brings that context home. Explore sales, pricing and inventory across three South Florida counties, then connect with Jennifer Susanne Sommers to understand the properties and neighborhoods that matter to you.
The figures below describe the $1,000,000+ segment for July–September 2026. Single-family homes and condominiums are presented separately. County statistics do not establish the value of an individual home.
01 / COUNTY REPORT
Palm Beach
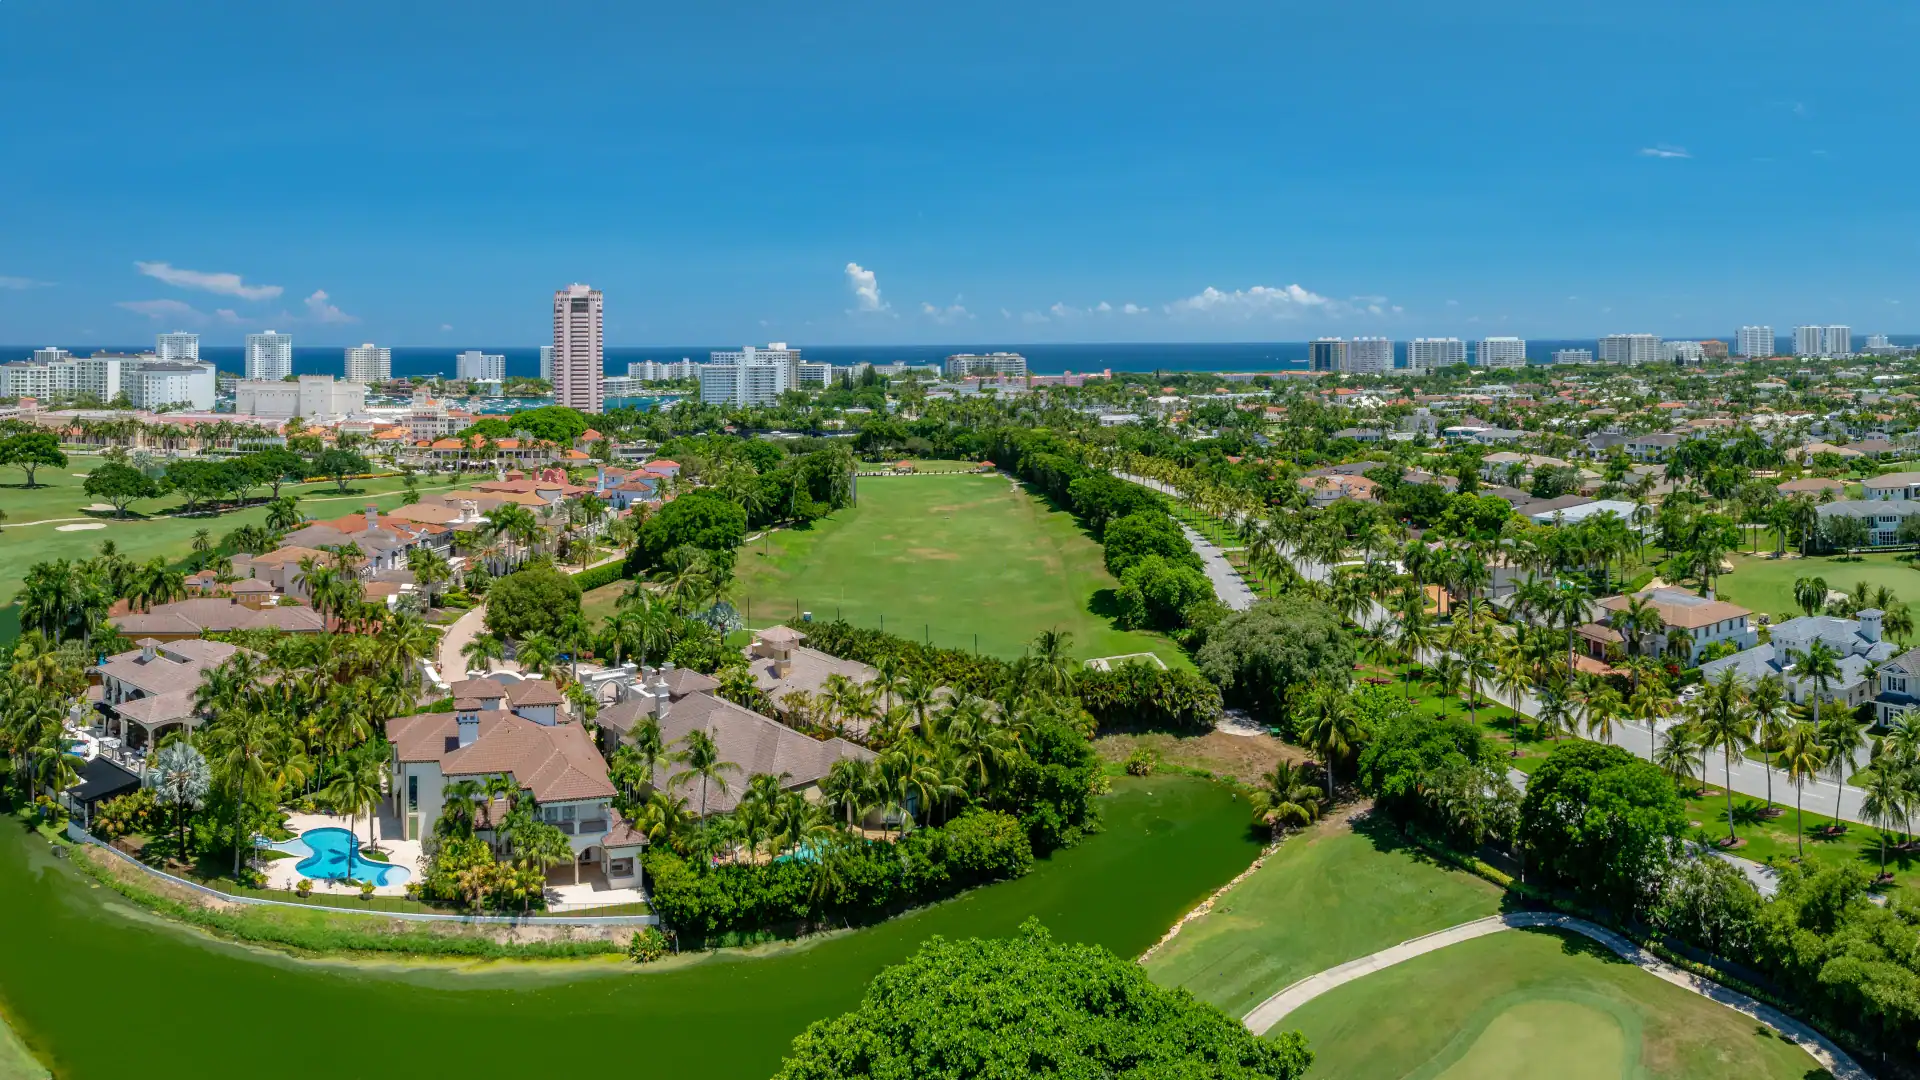
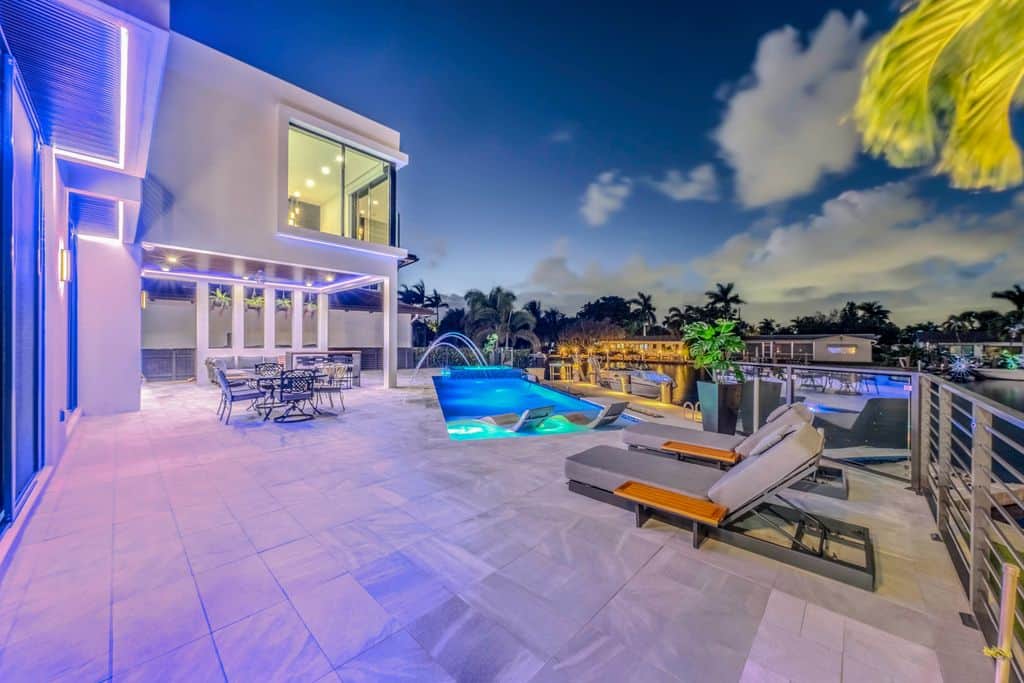
A distinctive mix of waterfront estates, private club residences and coastal condominiums. Compare the county perspective with the particular neighborhood, building and price range you are considering.
EXPLORE THE NUMBERS →02 / COUNTY REPORT
Broward
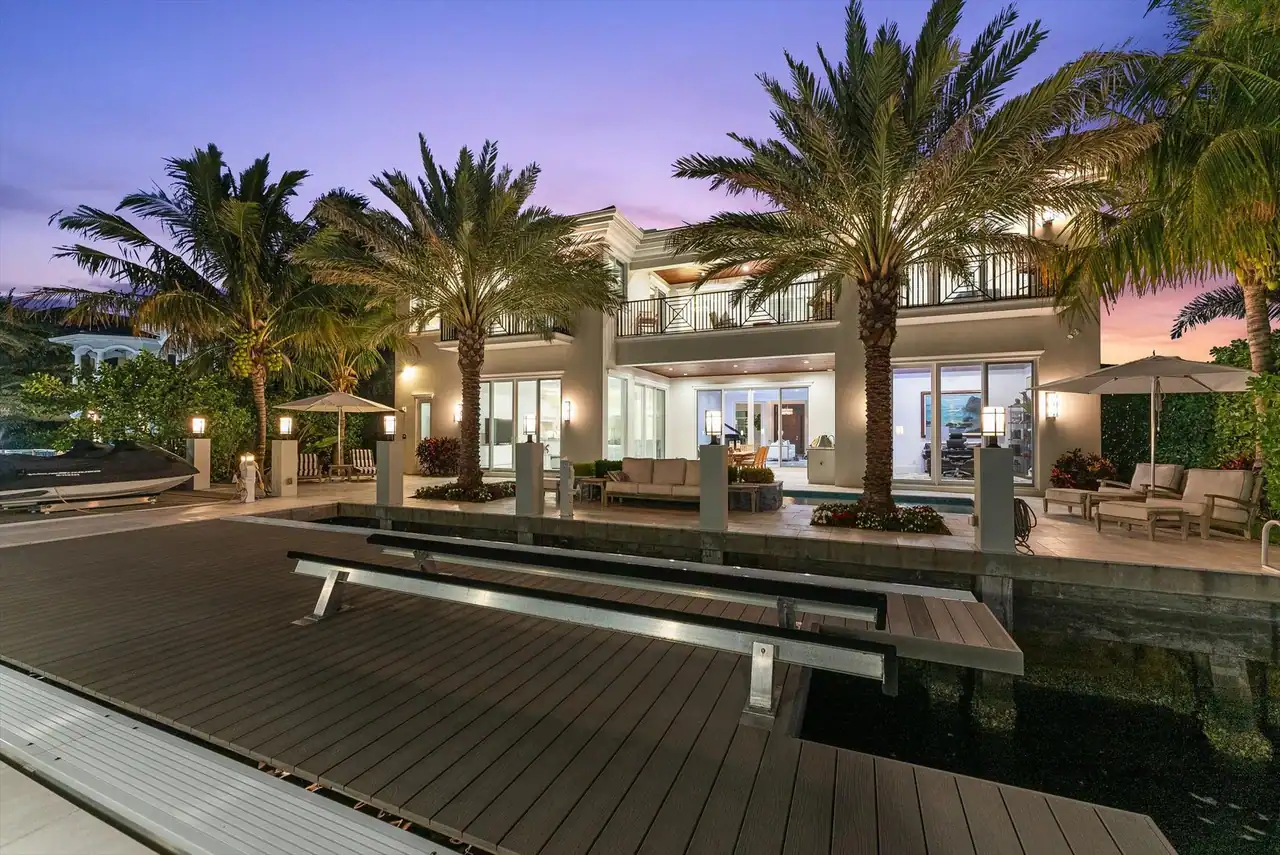
From an Intracoastal address to an established residential enclave, Broward offers many ways to live. Use the numbers to frame a conversation about location, condition and comparable properties.
EXPLORE THE NUMBERS →03 / COUNTY REPORT
Miami-Dade
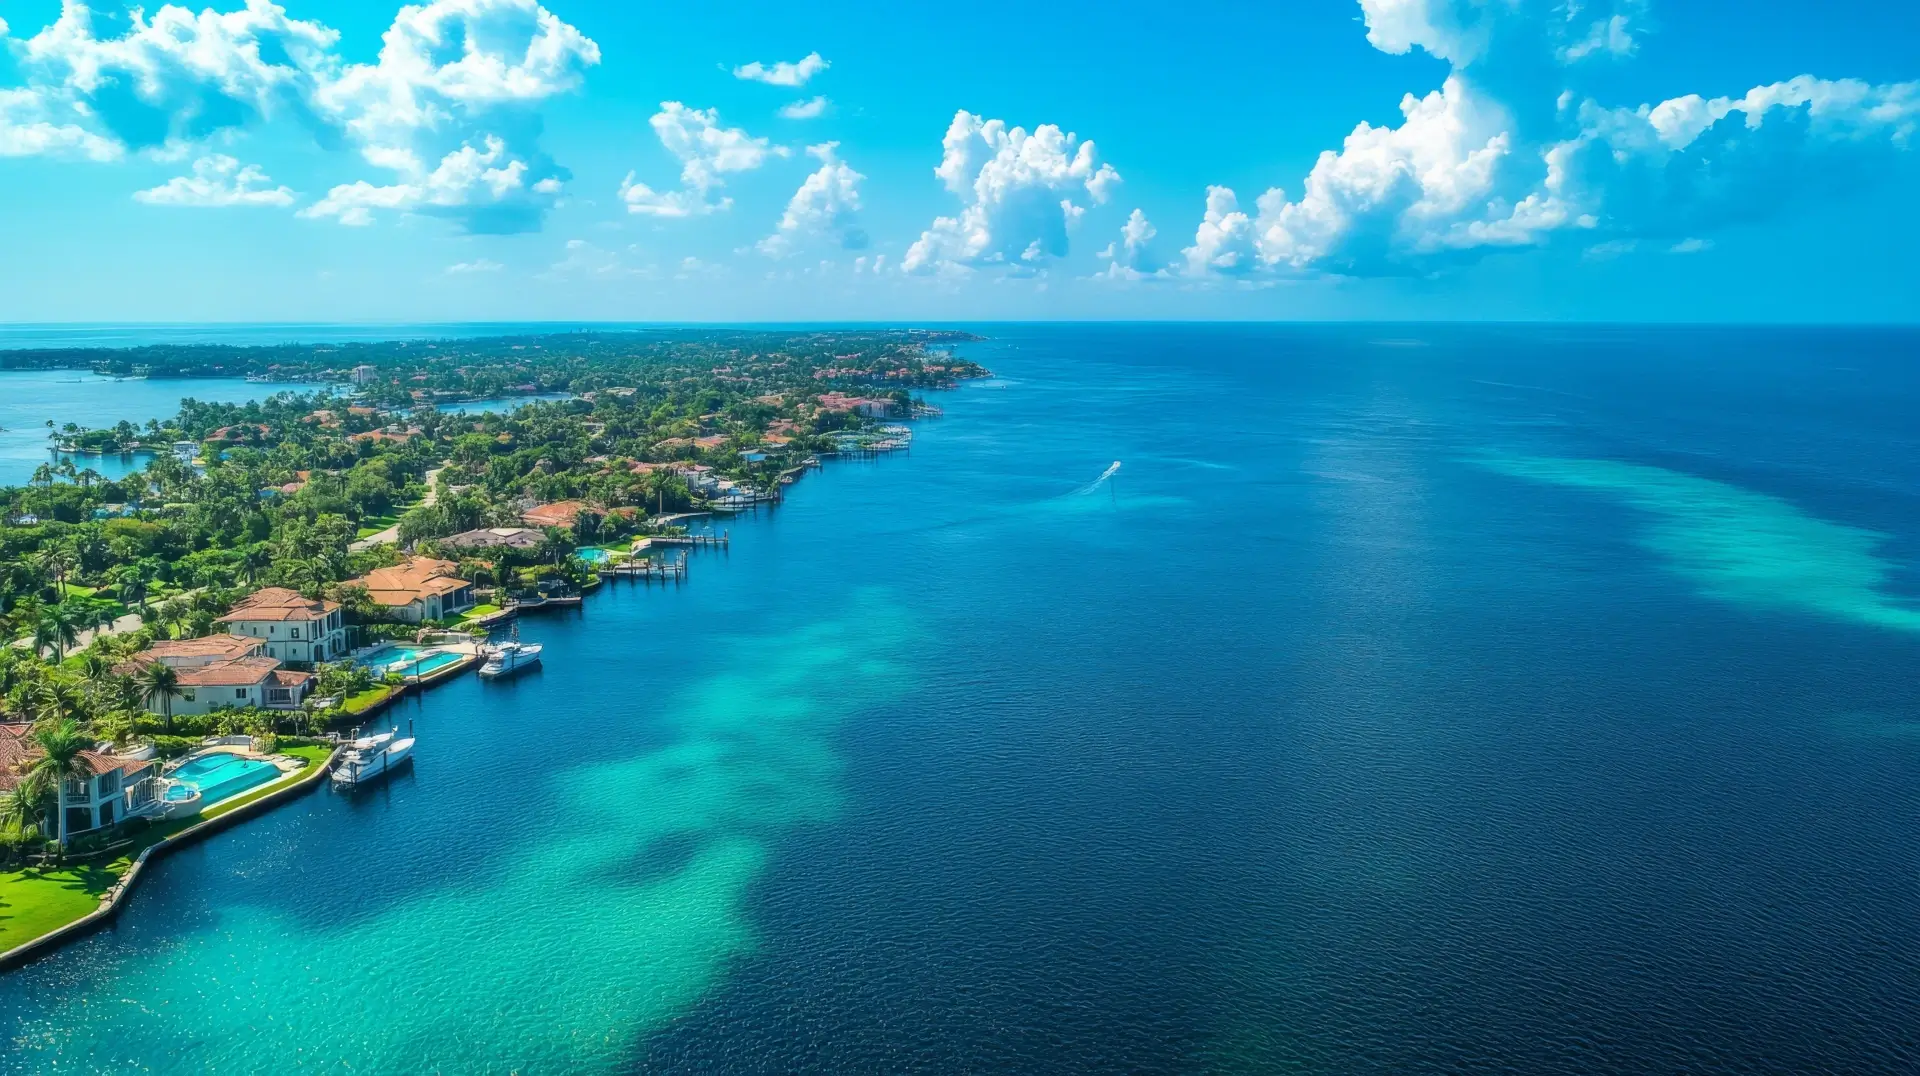
An international market spanning urban towers, waterfront neighborhoods and established estate settings. Property type and location matter when translating a county trend into an individual decision.
EXPLORE THE NUMBERS →COUNTY PERSPECTIVE / Q3 2026
Palm Beach County
Luxury single-family sales rose 27% year over year; condominium sales rose 23%. The two segments showed different median-price trends.
| Measure | Single-family | Condominiums |
|---|---|---|
| Active listings | 1,706−14% | 724−11% |
| Closed sales | 987+27% | 194+23% |
| Average sale price | $3.08M+24% | $2.49M+7% |
| Median sale price | $1.80M+13% | $1.76M−1% |
| Median price / sq. ft. | $579+9% | $876+3% |
| Average days on market | 76 | 102 |
| Highest sale price | $83.2M | $17M |
A quarter in motion
Single-family activity
NAVY: NEW LISTINGS / GOLD: CLOSED SALES
Condominium activity
NAVY: NEW LISTINGS / GOLD: CLOSED SALES
Source: Q3 2026 county figures, TRENDS Market Report. Viewed October 22, 2026. This is a quarterly snapshot of the report’s $1,000,000+ segment, not live inventory or the entire county market.
Request a Palm Beach Market Analysis →COUNTY PERSPECTIVE / Q3 2026
Broward County
Single-family sales increased 24% year over year. Condominium sales increased 3%, while their median sale price rose 11%.
| Measure | Single-family | Condominiums |
|---|---|---|
| Active listings | 1,314−11% | 706−1% |
| Closed sales | 652+24% | 109+3% |
| Average sale price | $2.04M+4% | $2.05M+20% |
| Median sale price | $1.48M+4% | $1.57M+11% |
| Median price / sq. ft. | $485+1% | $737+9% |
| Average days on market | 74 | 126 |
| Highest sale price | $42M | $7.25M |
A quarter in motion
Single-family activity
NAVY: NEW LISTINGS / GOLD: CLOSED SALES
Condominium activity
NAVY: NEW LISTINGS / GOLD: CLOSED SALES
Source: Q3 2026 county figures, TRENDS Market Report. Viewed October 22, 2026. This is a quarterly snapshot of the report’s $1,000,000+ segment, not live inventory or the entire county market.
Request a Broward Market Analysis →COUNTY PERSPECTIVE / Q3 2026
Miami-Dade County
Single-family sales rose 15% year over year and the median price rose 12%. Condominium sales rose 8%, alongside a 3% decline in the median sale price.
| Measure | Single-family | Condominiums |
|---|---|---|
| Active listings | 1,739−23% | 2,446−13% |
| Closed sales | 730+15% | 427+8% |
| Average sale price | $3.29M+16% | $2.71M−7% |
| Median sale price | $1.85M+12% | $1.70M−3% |
| Median price / sq. ft. | $757+9% | $978+3% |
| Average days on market | 89 | 113 |
| Highest sale price | $72M | $30.25M |
A quarter in motion
Single-family activity
NAVY: NEW LISTINGS / GOLD: CLOSED SALES
Condominium activity
NAVY: NEW LISTINGS / GOLD: CLOSED SALES
Source: Q3 2026 county figures, TRENDS Market Report. Viewed October 22, 2026. This is a quarterly snapshot of the report’s $1,000,000+ segment, not live inventory or the entire county market.
Request a Miami-Dade Market Analysis →How to read the report
Price & mix
The median is the midpoint of recorded sale prices. The average can move with a small number of exceptional sales. Compare both with recent property-level transactions.
Inventory & activity
Active listings describe available supply in the reporting snapshot; closed sales describe completed transactions. Monthly new listings and sales measure different events.
Timing & context
Days on market is a segment average. Location, presentation, pricing, building characteristics and property condition can create a very different individual experience.
YOUR NEXT MOVE
The numbers are a beginning.
The conversation is personal.
Request a market analysis for your home, a neighborhood comparison or a selection of available properties across Palm Beach, Broward and Miami-Dade.
Jennifer Susanne Sommers
Sotheby’s International Realty
Data source: linked Q3 2026 TRENDS county reports. Original AgentBoca presentation and commentary. Figures are historical, subject to source revisions and are not forecasts. No automatic data feed is implied.
Connect